


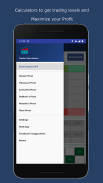

Trade Calculators
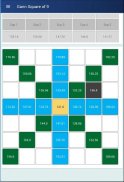
Gann Square of 9 and Pivots
وصف لـTrade Calculators: Gann Square of 9 and Pivots
Whether you are a price action, a pattern, an indicator or whatever trader, ability to identify strong price levels on your charts can greatly improve the quality and profitability of your trading. Instead of taking false signals and wrong trades, the better trades usually happen at key price levels. Those strong areas of interest show that buyers and sellers are concentrating at those levels and they can be the starting or turning points for new price moves and mark new trends as well.
If you are a breakout trader, you need to find areas that can lead to strong breakouts, if you are a trend-following trader you must identify pullback areas or trend continuation points, a reversal trader looks for key turning points and a range trader should focus on well-developed ranges with clearly defined price levels.
Expert analysts or experienced traders always use certain tools and techniques to ascertain support or resistance level, each of which is important because it represents a point at which a major price movement is expected to occur.
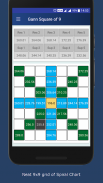
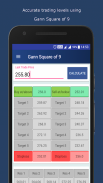
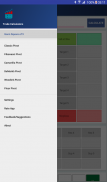
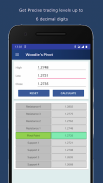
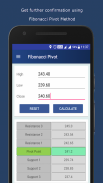
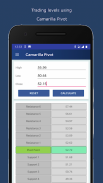
Gann Square of 9 and Pivot Points are hugely popular and used widely. Please use our calculators and precisely determine the trading levels, blend it with technical or other analysis and maximize your profits.
* Our level finding calculators are some great ways to identify areas of support and resistance, but they work best when combined with other kinds of technical analysis
* Trade Calculators is a tool to help you find the levels for support, resistance and targets, however, responsibility for any trades taken based on the levels generated using this tool will solely rely on the user. The developer or the ApverS team will not be held responsible for any losses or gains whatsoever.
* For any Feedback, Suggestions, Bug Reporting, or just to say Hi, please shoot at tradecalc.apvers@gmail.com
Disclosure/Disclaimer
1. This application is only for educational purpose. It uses standard mathematical formulas to determine various support and resistance levels. It does not assure any kind of firm resistance and support values for trading purpose.
2. The user of this application understands the risks involved in trading based on volatility in the market and the universal circumstances. Hence, the User of the application will alone be responsible for trades carried based on levels generated in the application.
3. No legal liability will be taken by the developer in any circumstances for any losses or gains made by using the application.
Tags: Trade Calculators, TradeCalculators, Trading Calculator, Trade, Trading, Calculator, Calculators, Levels, Gann Square Of 9, Pivot Points, Fibonacci Pivot, Camarilla, DeMark's, Woodie's, Floor
سواء كنت حركة سعر أو نمط أو مؤشر أو أي تاجر ، فإن القدرة على تحديد مستويات سعر قوية على الرسوم البيانية الخاصة بك يمكن أن تحسن بشكل كبير من جودة وربحية التداول الخاص بك. بدلاً من أخذ إشارات خاطئة وتداولات خاطئة ، عادةً ما تحدث التداولات الأفضل عند مستويات السعر الرئيسية. وتبين مجالات الاهتمام القوية هذه أن المشترين والبائعين يركزون على هذه المستويات ، ويمكن أن يكونوا نقطة البداية أو نقطة التحول لحركات الأسعار الجديدة وتحديد الاتجاهات الجديدة أيضًا.
إذا كنت تاجرًا متجاوزًا ، فأنت بحاجة إلى إيجاد مناطق يمكن أن تؤدي إلى اختراق قوي ، إذا كنت متداولًا متجهاً للاتجاه ، فيجب عليك تحديد مناطق الانسحاب أو نقاط استمرار الاتجاه ، حيث يبحث المتداول الانعكاسي عن نقاط تحول رئيسية ويجب على تاجر نطاق التركيز على النطاقات المتطورة مع مستويات سعر محددة بوضوح.
يستخدم المحللون الخبراء أو المتداولين ذوي الخبرة دائمًا بعض الأدوات والتقنيات للتأكد من مستوى الدعم أو المقاومة ، وكل منها مهم لأنه يمثل نقطة يتوقع أن تحدث فيها حركة سعر رئيسية.
تحظى ساحة جان من 9 ونقاط بيفوت بشعبية كبيرة وتستخدم على نطاق واسع. يرجى استخدام الآلات الحاسبة لدينا وتحديد مستويات التداول بدقة ، مزجها مع التحليل الفني أو تحليل آخر وتحقيق أقصى قدر من الأرباح الخاصة بك.
* الآلات الحاسبة الخاصة بإيجاد المستوى لدينا هي بعض الطرق الرائعة لتحديد مجالات الدعم والمقاومة ، ولكنها تعمل بشكل أفضل عندما تقترن بأنواع أخرى من التحليل الفني
* حاسبات التجارة هي أداة تساعدك في العثور على مستويات الدعم والمقاومة والأهداف ، ومع ذلك ، فإن المسؤولية عن أي صفقات يتم اتخاذها استنادًا إلى المستويات التي يتم إنشاؤها باستخدام هذه الأداة تعتمد فقط على المستخدم. لن يكون المطور أو فريق ApverS مسؤولين عن أي خسائر أو مكاسب مهما كانت.
* للحصول على أي ملاحظات أو اقتراحات أو الإبلاغ عن الأخطاء أو لمجرد التعبير عن رأيي ، يرجى إطلاق النار على tradecalc.apvers@gmail.com
الكشف / تنويه
1. هذا التطبيق هو فقط للأغراض التعليمية. ويستخدم المعادلات الرياضية القياسية لتحديد مستويات الدعم والمقاومة المختلفة. لا يضمن أي نوع من المقاومة القوية وقيم الدعم لغرض التداول.
2. يتفهم مستخدم هذا التطبيق المخاطر التي ينطوي عليها التداول على أساس التقلبات في السوق والظروف العامة. ومن ثم ، فإن مستخدم التطبيق سيكون وحده مسؤولاً عن الصفقات التي يتم تداولها على أساس المستويات المتولدة في الطلب.
3. لا يتحمل المطور أية مسؤولية قانونية في أي ظرف من الظروف عن أي خسائر أو مكاسب تتم باستخدام التطبيق.
العلامات: الآلات الحاسبة التجارية ، TradeCalculators ، آلة حاسبة التداول ، التجارة ، التداول ، آلة حاسبة ، الآلات الحاسبة ، المستويات ، ساحة Gann من 9 نقاط Pivot ، محور فيبوناتشي ، Camarilla ، DeMark's ، Woodie's ، الطابق
Trade Calculators : Gann Square of 9 and Pivots - إصدار 1.2.1
(14-03-2020)Trade Calculators: Gann Square of 9 and Pivots - معلومات APK
نُسخة APK: 1.2.1الحزمة: com.apvers.tradecalculatorsآخر إصدار من Trade Calculators : Gann Square of 9 and Pivots


 4.83
4.83


تطبيقات من الفئة نفسها


